Candlestick Patterns Every Trader Must Know
Candlestick patterns are one of the most powerful tools in a trader’s arsenal. Originating from Japanese rice traders in the 18th century, these visual price movement indicators help traders understand market sentiment and make more informed decisions. Whether you're a beginner or a seasoned trader, mastering key candlestick patterns can significantly enhance your trading strategy.
What Are Candlestick Patterns?
Candlestick charts display price movements of a security over a specific time period. Each candlestick provides four key pieces of information:
- Open price
- Close price
- High price
- Low price
The body of the candle represents the range between the open and close prices, while the wicks (also known as shadows) show the highs and lows. Patterns formed by one or more candlesticks can indicate potential reversals, continuations, or periods of indecision in the market.
Candlestick Anatomy
Top Candlestick Patterns Every Trader Should Know
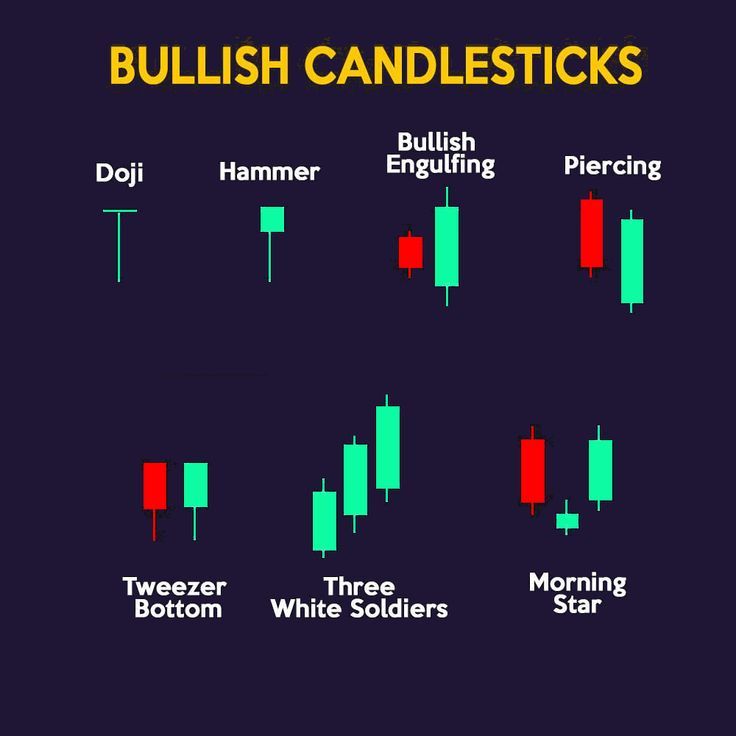
1. Doji
Reversal SignalA Doji forms when the opening and closing prices are virtually the same, indicating indecision in the market.
Significance: Potential reversal signal, especially when found at the top or bottom of a trend.
Types: Standard Doji, Long-Legged Doji, Dragonfly Doji, Gravestone Doji.
2. Hammer and Hanging Man
Bullish/BearishBoth have small bodies and long lower shadows.
Hammer: Appears at the bottom of a downtrend. Bullish reversal signal.
Hanging Man: Appears at the top of an uptrend. Bearish reversal signal.
3. Engulfing Patterns
Reversal SignalThese patterns consist of two candles.
Bullish Engulfing:A small red candle followed by a large green candle that "engulfs" the red one. Sign of a potential bullish reversal.
Bearish Engulfing: A small green candle followed by a large red candle that engulfs it. Indicates a potential bearish reversal.
4. Morning Star and Evening Star
Three-Candle ReversalThree-candle patterns that signal reversals.
Morning Star: Bearish candle → Doji or small-bodied candle → Bullish candle. Indicates a potential bullish reversal.
Evening Star: Bullish candle → Doji or small-bodied candle → Bearish candle. Suggests a bearish reversal.
5. Shooting Star and Inverted Hammer
Reversal SignalThese patterns have small bodies with long upper shadows.
Shooting Star: Appears after an uptrend. Bearish reversal signal.
Inverted Hammer:Appears after a downtrend. Bullish reversal signal.
6. Three White Soldiers and Three Black Crows
Strong Trend SignalStrong continuation or reversal signals consisting of three consecutive candles.
Three White Soldiers: Three consecutive bullish candles. Strong bullish trend signal.
Three Black Crows: Three consecutive bearish candles. Strong bearish trend signal.
How to Use Candlestick Patterns in Trading
Combine with Technical Indicators
Use support and resistance levels, moving averages, or RSI to confirm patterns.
Consider Volume
A pattern forming with high volume tends to be more reliable and significant.
Practice Risk Management
Always set stop-loss and take-profit levels.
Final Thoughts
Understanding candlestick patterns can provide critical insights into market psychology and price action. While they are not foolproof, when combined with other technical tools and a sound trading plan, candlestick patterns can become a valuable component of your trading strategy. Stay disciplined, continue learning, and never trade based on patterns alone without confirmation. The charts are telling a story — make sure you know how to read it.