In the fast-paced world of trading, having a solid strategy is essential to staying ahead of market trends and making informed decisions. One of the most powerful strategies used by traders across the globe is technical analysis. Whether you're a novice investor or a seasoned trader, mastering the core tools of technical analysis can significantly enhance your ability to predict price movements and manage risk.
What is Technical Analysis?
Technical analysis is a method of evaluating securities by analyzing statistical trends from trading activity—such as price movement and volume. Unlike fundamental analysis, which focuses on a company’s financial health and intrinsic value, technical analysis is rooted in chart patterns and indicators that reflect market sentiment and psychology.
Technical analysis is based on the premise that historical price action can help predict future price movements.
Why Use Technical Analysis?
Predict Price Movements
Helps forecast future price direction based on historical data.
Identify Trends
Recognizes the beginning and end of trends to inform entry and exit points.
Manage Risk
Supports better stop-loss and profit-taking strategies.
Applicable to Any Market
Useful in stocks, forex, crypto, commodities, and more.
Essential Tools Every Trader Should Master
Mastering these key technical analysis tools can significantly enhance your trading strategy and decision-making process.
1. Price Charts
At the heart of technical analysis are price charts, which visually represent the movement of a security over time. The most common types include:
Line Chart
Simplest form, showing closing prices over time.
Bar Chart
Displays opening, closing, high, and low prices for each time period.
Candlestick Chart
Most popular, offering the same information as bar charts but in a more visually intuitive format.
2. Trendlines and Channels
Trendlines help traders identify the general direction of the market—uptrend, downtrend, or sideways. Channels are formed when two trendlines run parallel, helping to define support and resistance levels.
Uptrend
Higher highs and higher lows.
Downtrend
Lower highs and lower lows.
Sideways
Relatively stable highs and lows.
3. Support and Resistance Levels
These are key areas where price tends to reverse or pause.
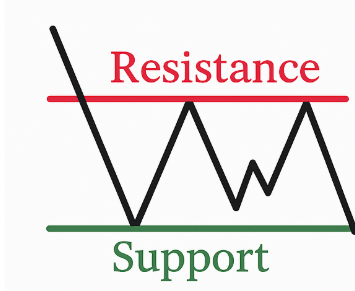
Support
A price level where a downtrend can be expected to pause due to a concentration of buying interest.
Resistance
A level where an uptrend may stall due to selling pressure.
Identifying these levels helps traders set entry points, stop losses, and targets.
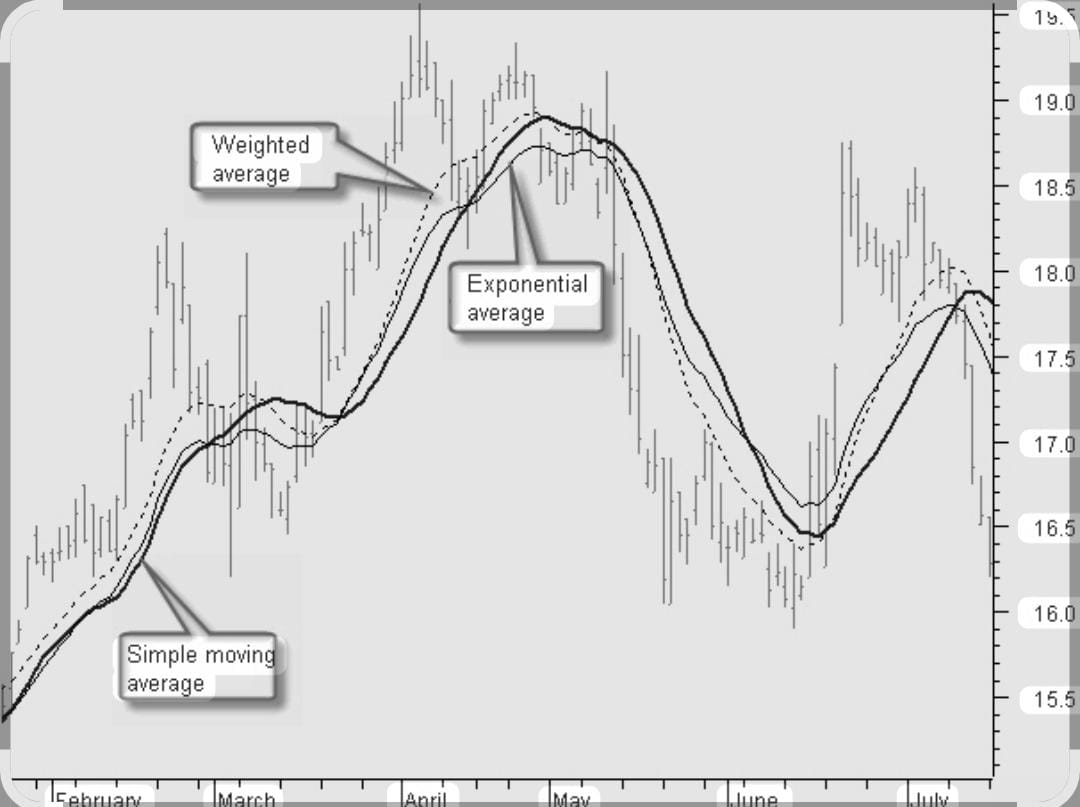
4. Moving Averages
Trendlines help traders identify the general direction of the market—uptrend, downtrend, or sideways. Channels are formed when two trendlines run parallel, helping to define support and resistance levels.
Simple Moving Average (SMA)
The average of closing prices over a specified time.
Exponential Moving Average (EMA)
Gives more weight to recent prices, making it more responsive.
Common strategies involve using crossovers, such as when a short-term average crosses above or below a long-term average.
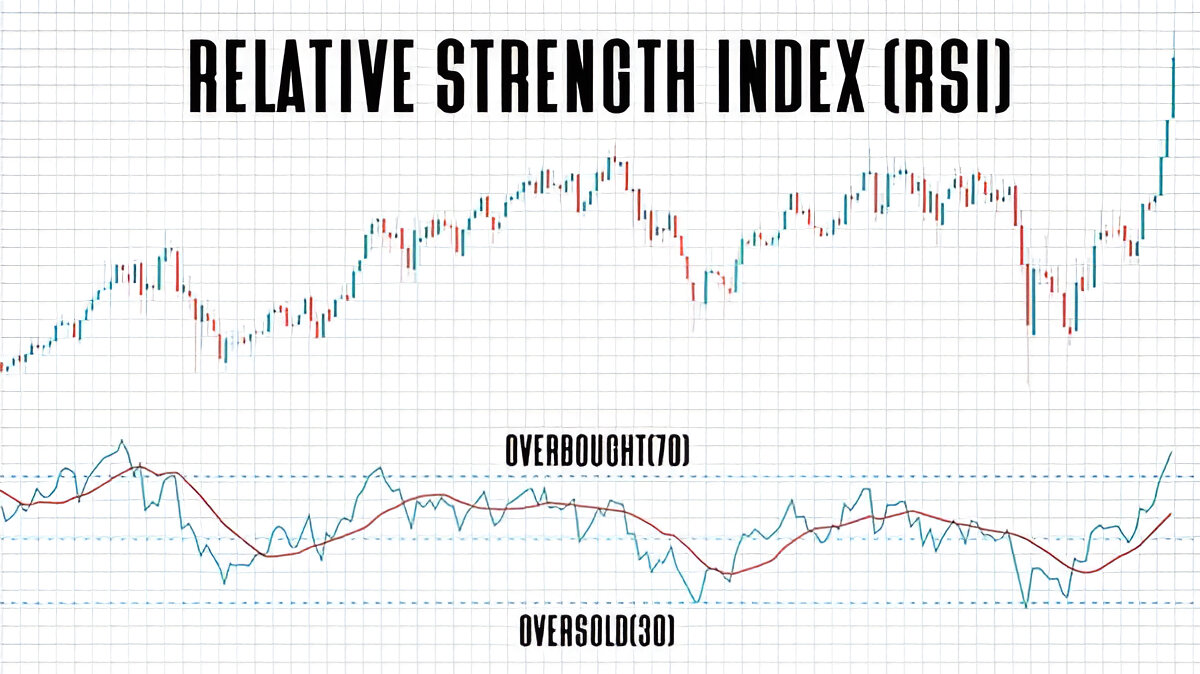
5. Relative Strength Index (RSI)
RSI is a momentum oscillator that measures the speed and change of price movements. It ranges from 0 to 100 and is typically used to identify overbought or oversold conditions.
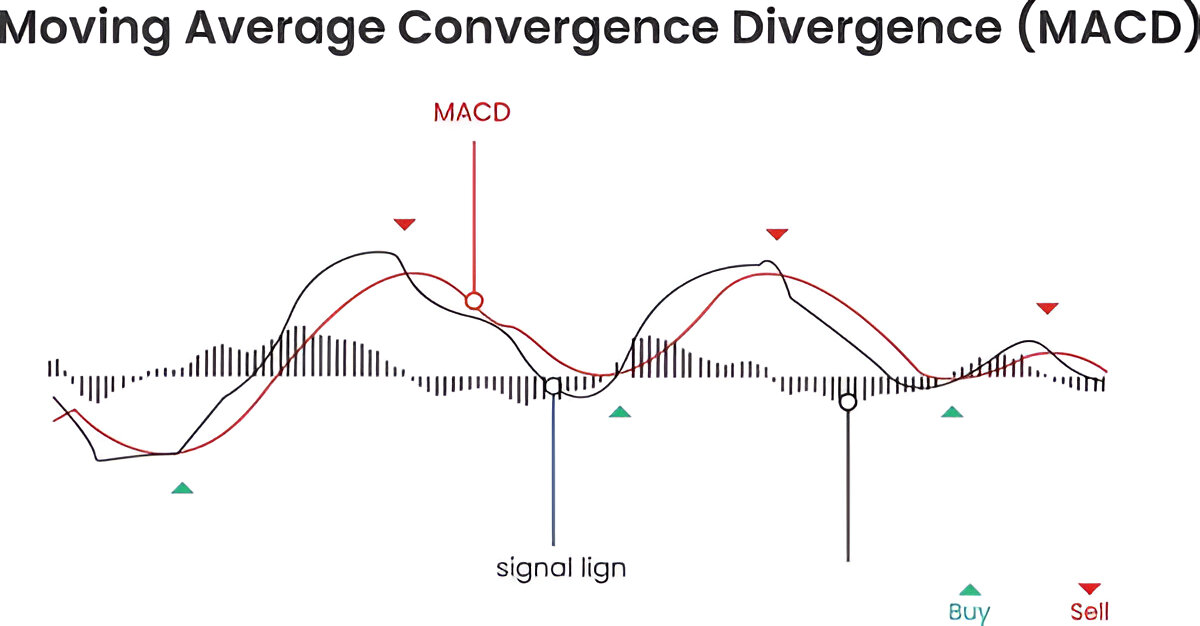
6. MACD (Moving Average Convergence Divergence)
MACD is a trend-following momentum indicator that shows the relationship between two moving averages. It helps identify potential buy/sell signals when the MACD line crosses above or below the signal line.
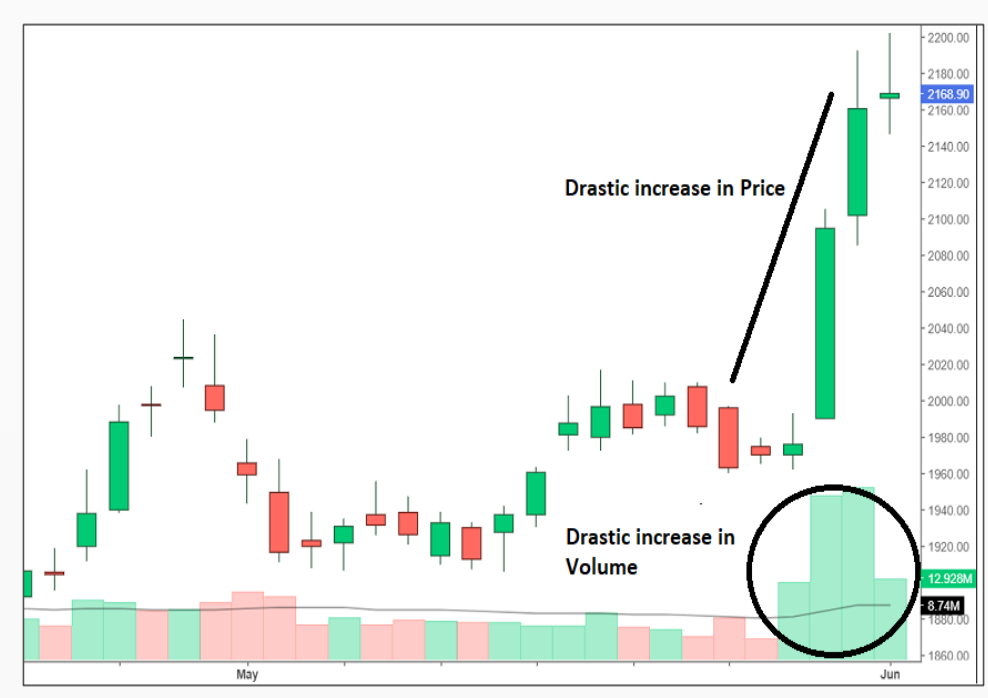
7. Volume Analysis
Volume indicates the number of shares traded during a given period and is often used to confirm the strength of a trend. An increase in volume suggests strong conviction behind a price move.
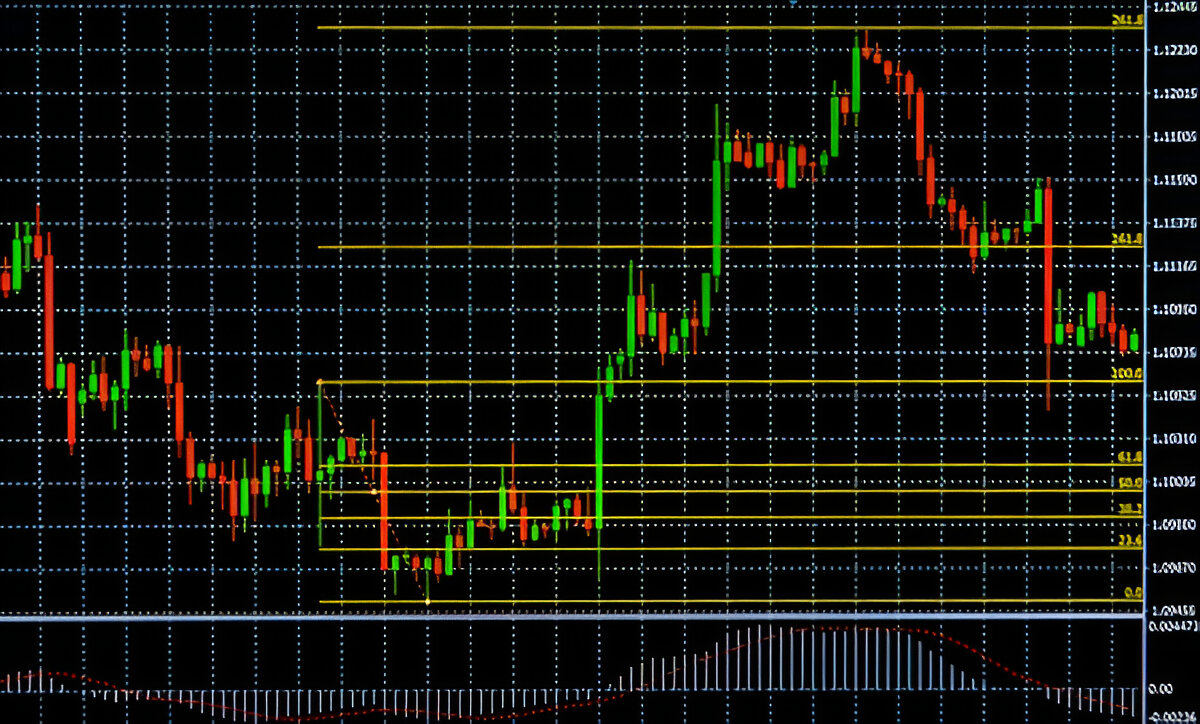
8. Fibonacci Retracement
This tool uses horizontal lines to indicate areas of support or resistance at the key Fibonacci levels before the price continues in the original direction. It's particularly useful in identifying potential reversal zones during pullbacks.
Conclusion
Mastering technical analysis doesn't happen overnight, but understanding and applying these fundamental tools can give traders a significant edge. By learning to read charts, recognize trends, and interpret indicators, you’ll be better equipped to navigate the markets with confidence and precision.
Whether you're trading for a living or investing as a side hustle, technical analysis is a skill that can enhance your strategy and improve your decision-making. So grab your charts, apply these tools, and start analyzing with purpose!