Mastering Support and Resistance: A Practical Guide with Real Chart Examples
Support and resistance are foundational concepts in technical analysis, essential for traders aiming to predict price movements and make informed decisions. This guide delves into these concepts, illustrating their application with real chart examples to enhance your trading strategy.
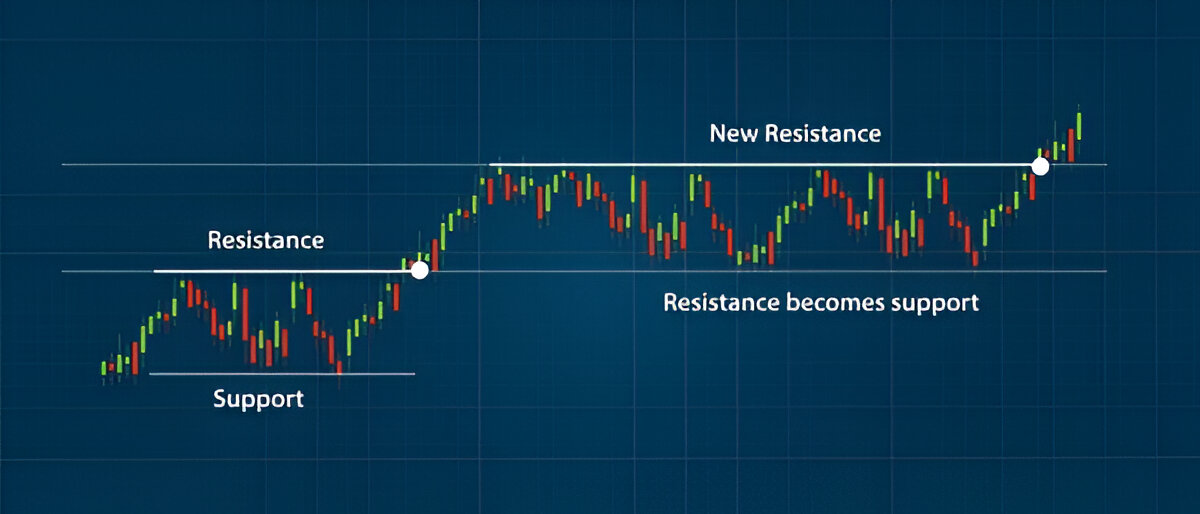
Understanding Support and Resistance
Support:
Moving Averages smooth out price data to identify the direction of the trend over a period. The two most common types are:A price level where a downtrend can be expected to pause due to a concentration of demand. As the price drops towards support, buyers become more inclined to purchase, creating a "floor" that supports the price.
Resistance:
A price level where an uptrend can be expected to pause due to a concentration of supply. As the price rises towards resistance, sellers become more inclined to sell, creating a "ceiling" that resists further price increases.
A price level where an uptrend can be expected to pause due to a concentration of supply. As the price rises towards resistance, sellers become more inclined to sell, creating a "ceiling" that resists further price increases.
Identifying Support and Resistance Levels
Historical Price Level:
Look for areas where the price has reversed multiple times in the past. These points often indicate strong support or resistance.
Round Numbers:
Prices ending in round numbers (e.g., $50, $100) often act as psychological support or resistance levels.
Moving Averages:
Common moving averages, like the 50-day or 200-day, can act as dynamic support or resistance levels.
Trendlines
Drawing lines connecting higher lows in an uptrend or lower highs in a downtrend can help identify support and resistance.
Fibonacci Retracement Levels
These are horizontal lines that indicate where support and resistance are likely to occur, based on the Fibonacci sequence.
Real chart Examples
Let's consider a hypothetical example using Apple Inc. (AAPL):
- Support Level: Suppose AAPL has historically bounced back after reaching $150. This price point would be considered a support level.
- Resistance Level: If AAPL has struggled to rise above $180, this price point would be considered a resistance level.
When the price approaches these levels, traders watch for signs of a bounce or a breakout.
Trading Strategies Using Support and Resistance
- Range Trading:Buy near support and sell near resistance when the price is moving within a range.
- BreakOut Trading:Enter a trade when the price breaks through a support or resistance level, anticipating that the price will continue in that direction.
- Pullback Trading:After a breakout, wait for the price to pull back to the broken support or resistance level (now acting as the opposite) before entering a trade.
Conclusion
Support and resistance levels are crucial tools in a trader's arsenal, offering insights into potential price movements and helping to inform trading decisions. By understanding and identifying these levels, traders can better anticipate market behavior and develop more effective trading strategies.